Analytic Tradecraft Standard 9 requires that intelligence products “incorporate visual information to clarify an analytic message and to complement or enhance the presentation of data and analysis” (ICD 203 2015). The standard doesn’t demand graphics in every product; it requires analysts to recognize when a visual would serve the reader better than prose alone and to execute it well enough that it actually helps. ICD203 notes that visual information may range from plain presentation of intelligence information to interactive displays for complex analytic concepts, and that all of the content in an analytic product may be presented visually (ICD 203 2015). A threat assessment for a major public event might be more useful as an annotated map with a supporting narrative than as a ten-page written report. A competitive intelligence briefing on market entry timing might land faster as a timeline of competitor milestones than as a prose summary of the same data. The format should follow the information, and the analyst’s job is to match the two.
ICD203 also requires that analytic content in visual information adhere to other analytic tradecraft standards (ICD 203 2015). A chart that presents an unsourced claim is as much a sourcing failure as a sentence that does the same. A map that implies a judgment without distinguishing it from underlying intelligence violates the distinctions standard. A timeline that omits alternative interpretations of the sequence it depicts has the same alternatives problem as a written assessment that considers only one hypothesis. Analysts sometimes treat visuals as supporting material that operates under looser rules than the text around it, but the directive applies every standard to every format.
Why Visuals Work
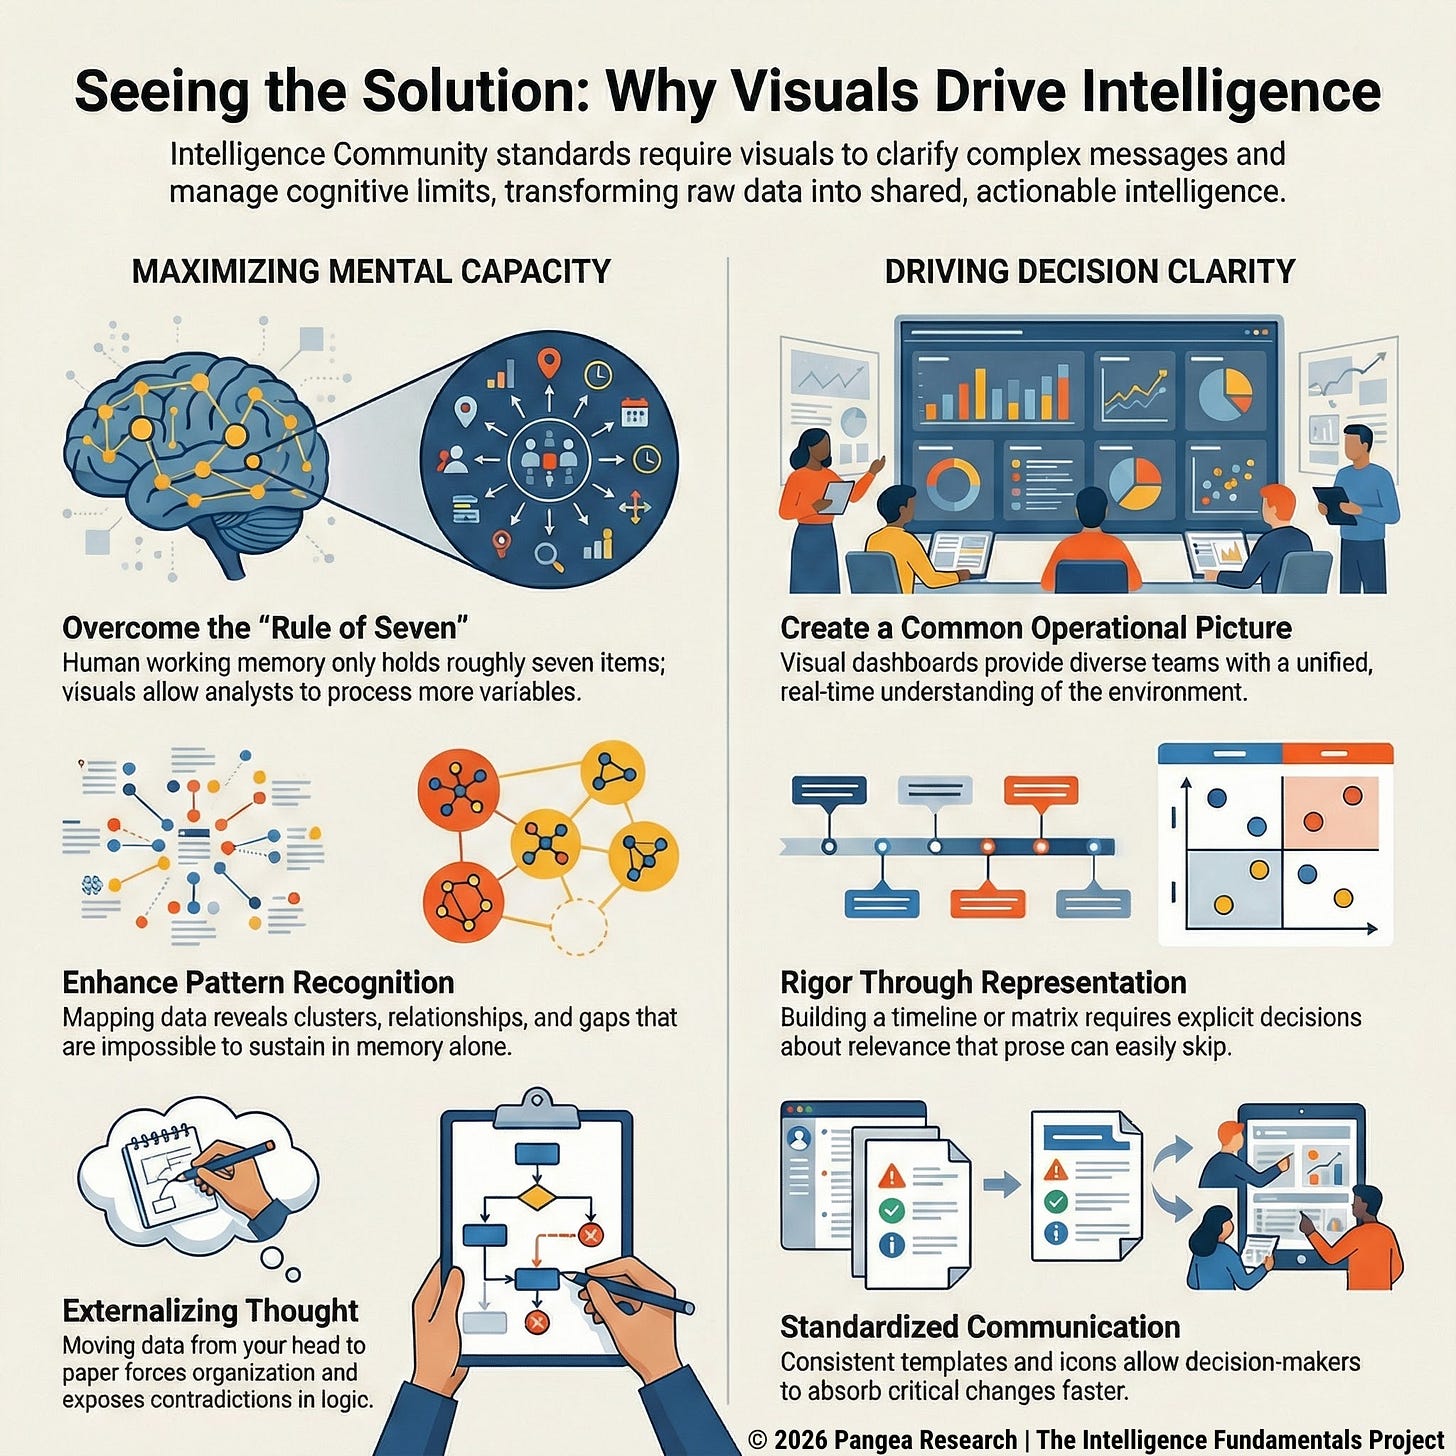
Human working memory holds roughly seven items, plus or minus two, at any given time, and complexity increases geometrically as the number of variables increases (Heuer 2008). Error-free analysis conducted entirely in the analyst’s head becomes extremely difficult once a problem involves more than a handful of moving parts, which is why Heuer identified decomposition and visualization as the two basic tools for managing cognitive limits. An analyst trying to track the relationships between twelve entities in a financial fraud investigation can hold some of those relationships in memory, but a link chart that maps all twelve entities and their connections makes the full network visible simultaneously. The analyst sees patterns, clusters, and gaps that memory alone couldn’t sustain long enough to evaluate. Heuer described the principle as getting all the pros and cons out of one’s head and onto paper in some visible, shorthand form (Heuer 1999).
Building a visual representation forces the analyst to organize information, identify relationships, and confront gaps in ways that narrative prose doesn’t demand. A law enforcement analyst constructing a timeline of a suspect’s movements has to decide what goes on the timeline and what gets left off, which forces explicit decisions about relevance. They have to place events in sequence, which exposes contradictions or gaps in the chronology that a written narrative might gloss over. A due diligence analyst mapping a corporate ownership structure through a link chart has to decide which entities to include and how to represent the relationships between them, which surfaces ambiguities in the source material that a narrative summary could paper over. In both cases, the finished visual is a communication tool for the reader and an analytical tool that improved the assessment before anyone else saw it.
Military doctrine builds visual products into the intelligence process as standard outputs. Army doctrine lists visualization products as standard intelligence outputs associated with situation development and requires the Common Intelligence Picture (CIP) to have both a visual and textual component (FM 2-0 2023). Joint doctrine describes the Common Operational Picture (COP) as a display of relevant information within a commander’s area of interest, tailored to the user’s requirements and based on common data shared by more than one command (JP 2-0 2013). A corporate security operations center that maintains a visual display of active threats, ongoing investigations, and facility status across multiple locations is applying the same principle: giving everyone who needs to make decisions a shared, current picture of the operating environment rather than requiring each person to reconstruct that picture from individual written reports.
Structured Techniques as Visualization
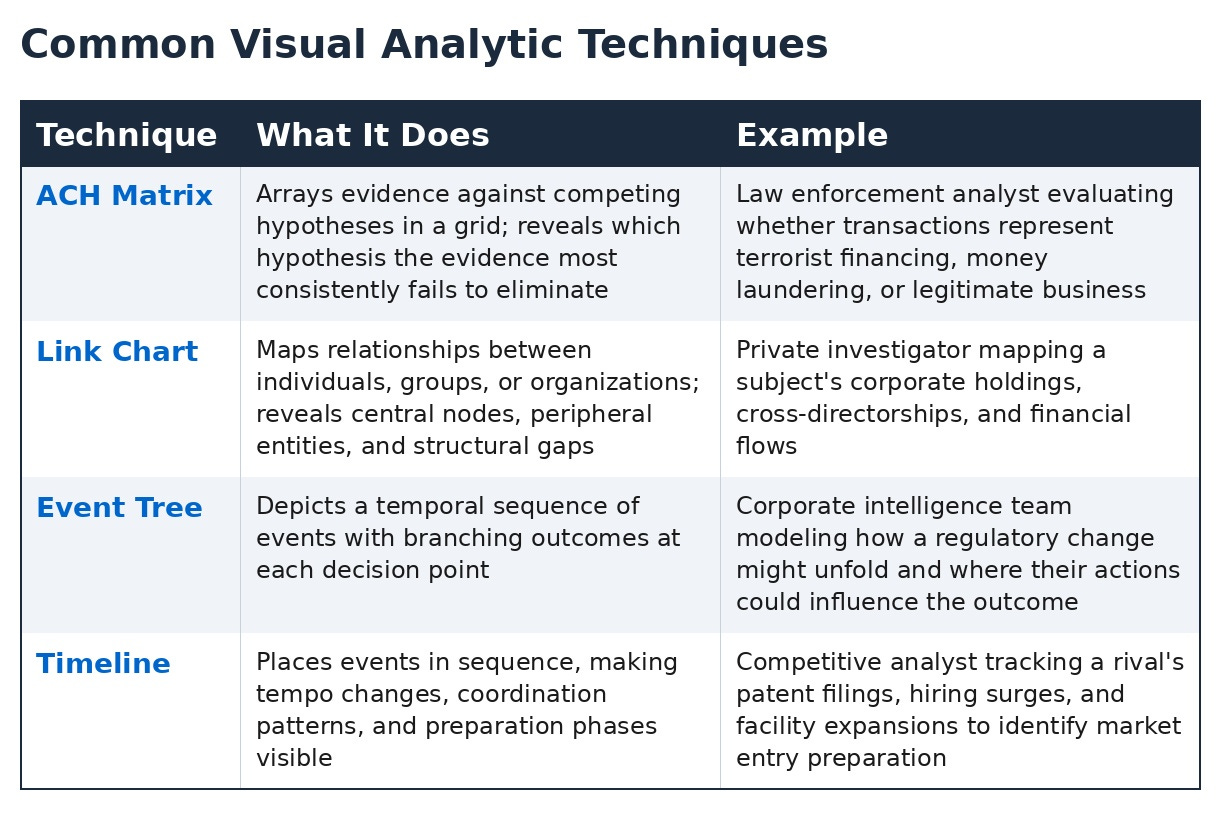
Matrices arrange data in a grid with as many cells as required to sort data and gain insight (CIA 2009). An analysis of competing hypotheses (ACH) matrix arrays evidence against competing hypotheses so the analyst can see which hypotheses the evidence supports and which it eliminates by looking at the pattern of entries across the grid. Link charts map relationships between individuals, groups, or organizations, making networks and clusters visible. Event trees depict a potential temporal sequence of events with branching outcomes at each decision point. Chronologies and timelines put events in context of both the time of the events and the time between events (CIA 2009). In each case, the analyst builds the visual to organize their own thinking, and the finished product communicates the result to the reader.
When Visuals Fail
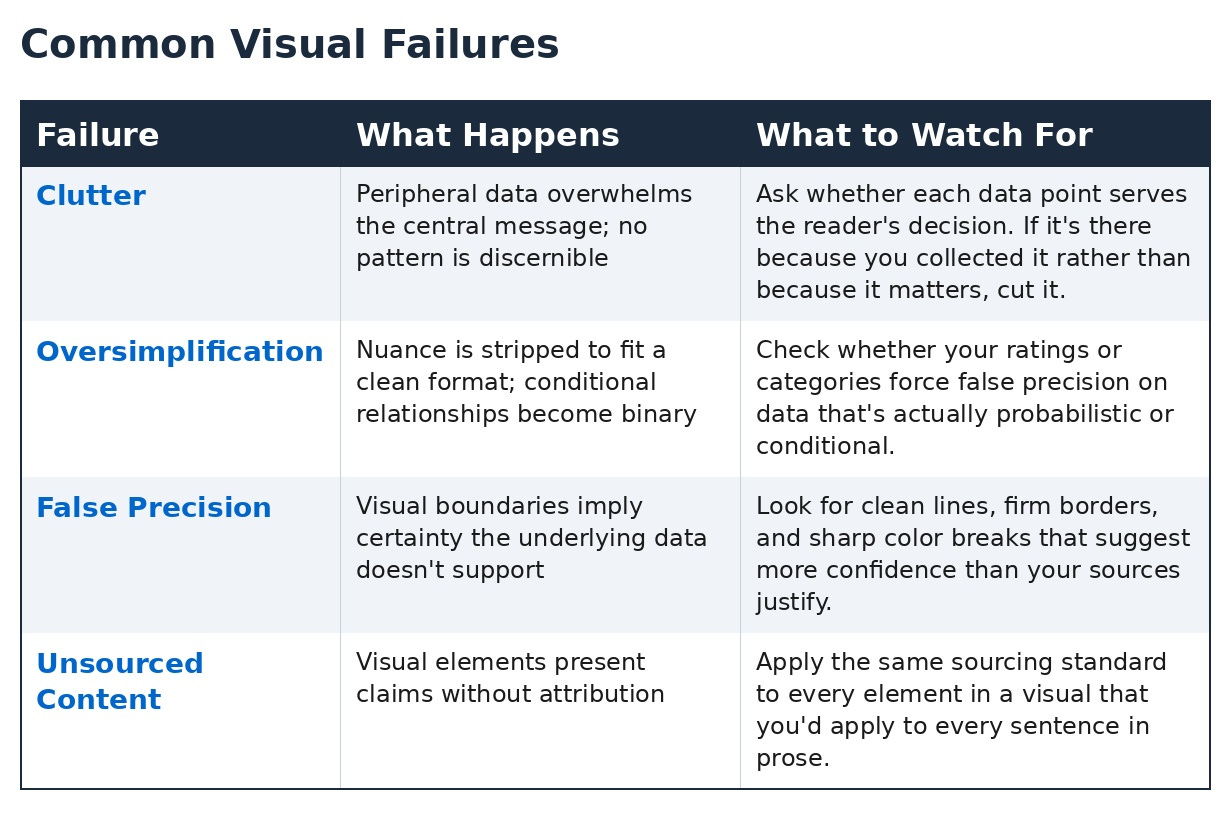
Charts become cluttered when every available data point is included and peripheral data overwhelms the central message (CIA 2009). An analyst who puts every entity they’ve collected onto a link chart because they spent time gathering it will produce a visual so dense that no pattern is discernible. That’s worse than no chart at all, because it implies complexity the analyst hasn’t actually sorted through. A corporate intelligence analyst preparing a competitive landscape for the executive team has to make the same call; a chart showing every competitor in the market is less useful than one that highlights the five competitors whose moves actually affect the company’s position.
Oversimplification does equal damage. A matrix that forces a binary yes/no evaluation of evidence against hypotheses when the actual relationship is conditional or probabilistic looks definitive but misrepresents the analysis (CIA 2009). A corporate intelligence analyst who builds a competitor comparison table with clean rankings across five dimensions has created something the executive team can absorb quickly, but if the rankings obscure the fact that a low-ranked competitor dominates the one segment the company is entering, the visual has actively misled the reader. ICD203 requires that visual information be “clear and pertinent to the product’s subject,” and that applies to clarity of meaning, not just clarity of design (ICD 203 2015).
Mapping social dynamics onto physical geography creates a particular version of this problem. Drawing a boundary around “territory controlled by Faction X” on a map implies a level of territorial coherence that may not exist on the ground (JP 2-0 2013). Color-coding regions by assessed threat level implies sharp distinctions at the borders that the actual threat landscape doesn’t have. A law enforcement analyst mapping gang territories for a patrol commander faces this directly: the map implies firm boundaries where the reality is a contested, shifting overlap zone, and a commander who plans patrol routes based on those firm boundaries will deploy resources differently than one who understands the boundaries are fluid. The visual has injected a precision the underlying analysis didn’t support, and the reader has no way to know that from the map alone.
Verifying Visual Information
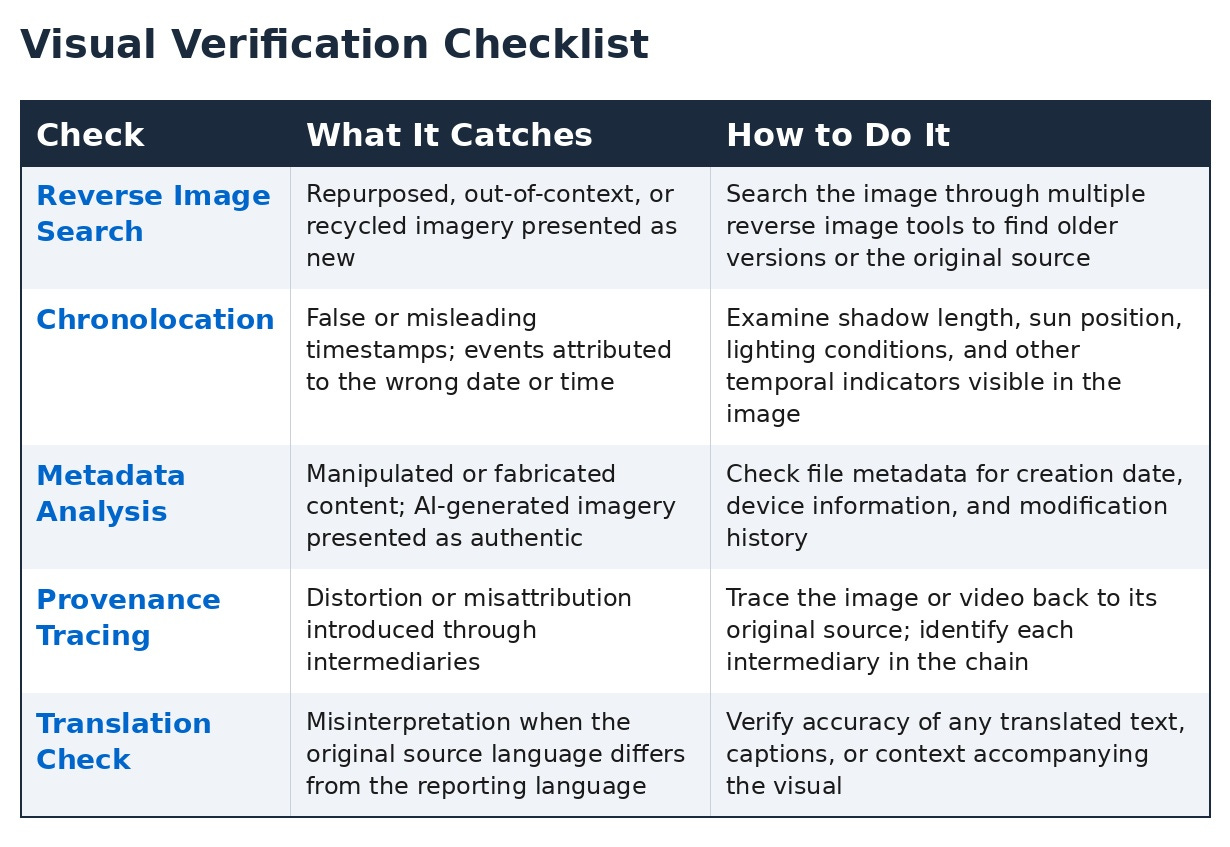
Online open-source imagery may not be what it’s purported to be, for reasons including misattribution, editing, modification of metadata, staging, and the use of artificial intelligence to create or manipulate content (Stover, Koenig & Freeman 2020). A video may be cut and joined to another video without the editor intending to suggest that the two parts ran sequentially. An image that appears to show damage from an airstrike, a protest crowd of a certain size, or a military vehicle at a particular location carries immediate persuasive force that text reporting doesn’t, and that persuasive force is exactly what makes unverified imagery dangerous as an analytical input. The analyst processes the image as evidence before the verification that should precede that processing. A private investigator using a social media photo to establish a subject’s location at a particular time, a corporate intelligence analyst incorporating satellite imagery of a competitor’s facility expansion, and a law enforcement analyst using video footage to corroborate witness statements all face the same risk: the image feels like direct evidence because it shows rather than tells, but that directness can be manufactured.
Reverse image searches help establish provenance by finding older versions of content presented as new (Silverman 2020). If an image that’s supposed to be from yesterday already existed online six months ago, it’s been repurposed or taken out of context. Chronolocation, which corroborates the dates and times of events depicted in visual information, provides another verification path; it may be possible to determine the time of day a photograph was taken by examining the length of shadows cast by sunlight (Stover, Koenig & Freeman 2020). Metadata analysis, specifically determining when a piece of content was created, reveals what media generation or modification tools were available at the time it was produced. If the language of the original source differs from the language of the report, accuracy of translation should also be verified. An analyst who builds a judgment on unverified imagery has introduced a source vulnerability the reader can’t see in the finished product.
Making Visuals Work
A visual product that the reader can’t open, display, or integrate into their own systems has failed regardless of its analytical quality. Army doctrine requires that intelligence be in compatible data-file formats because usability determines whether the product actually supports further analysis and operational decisions (FM 2-0 2023). A threat map that can’t be overlaid on the commander’s operational display, a link chart in a file format the client’s system can’t render, or a timeline built in software the reader doesn’t have is analysis that never reaches the decision it was supposed to support. This is a relevance problem dressed up as a technical one: if the reader can’t use the product, it doesn’t matter how good the analysis is.
Templates for recurring products reduce the overhead of building visuals from scratch and give readers a familiar format they can absorb quickly (CIA 2009). A law enforcement fusion center that produces weekly threat assessments with a consistent map format, consistent color scheme, and consistent iconography enables its readers to process the current assessment faster because they already understand the visual language. A corporate intelligence team that uses the same competitive landscape chart format every quarter gives the executive team a baseline they can read changes against. The value of consistency increases with frequency: the more regularly a reader sees a visual product, the more important it is that the format stays stable so their attention goes to the content rather than the structure.
A shared visual representation of the current situation gives everyone working a problem a common frame of reference, and that principle scales to any team that produces intelligence for decision-makers. A corporate security team that maintains a visual dashboard of active investigations, current threat levels by region, and open intelligence requirements gives its analysts and its readers a shared picture that written reports alone can’t provide. The dashboard doesn’t replace written analysis; it provides the spatial and temporal context that makes written analysis more useful when the reader sits down with it. Even a small team that pins a regularly updated map or chart to a shared workspace is gaining the same benefit at a smaller scale.
Closing
Analysts who would never skip source evaluation or ignore uncertainty language will routinely produce text-only products on topics that would communicate better with a map, a timeline, or a chart. The standard asks the analyst to consider, for every product, whether a visual element would help the reader understand the message more clearly, more quickly, or more completely than prose alone. When the answer is yes and the analyst doesn’t include one, the product has a gap. An analyst who builds a map that implies precision the underlying evidence doesn’t support has produced a visual that looks professional and misleads the reader. The tradecraft standards don’t relax because the format changes; they apply to every element in a visual with the same force they apply to every sentence in prose.
References
Central Intelligence Agency. 2009. A Tradecraft Primer: Structured Analytic Techniques for Improving Intelligence Analysis. Washington, DC: Central Intelligence Agency.
Department of the Army. 2023. FM 2-0: Intelligence. Washington, DC: Department of the Army.
Heuer, Richards J., Jr. 1999. Psychology of Intelligence Analysis. Washington, DC: Center for the Study of Intelligence, Central Intelligence Agency.
Heuer, Richards J., Jr. 2008. “Taxonomy of Structured Analytic Techniques.” Presentation to the International Studies Association.
Joint Chiefs of Staff. 2013. Joint Publication 2-0: Joint Intelligence. Washington, DC: Joint Chiefs of Staff.
Office of the Director of National Intelligence. 2015. Intelligence Community Directive 203: Analytic Standards. Washington, DC: Office of the Director of National Intelligence.
Stover, Eric, Alexa Koenig, and Lindsay Freeman. 2020. Berkeley Protocol on Digital Open Source Investigations. United Nations Office of the High Commissioner for Human Rights and Human Rights Center, UC Berkeley School of Law.
Silverman, Craig, ed. 2020. Verification Handbook: For Disinformation and Media Manipulation. Maastricht: European Journalism Centre.
This piece was first published on our Substack.
Read the original on Substack